- Category
- AI / ML · quantitative finance · portfolio intelligence
- Type
- Screening → scoring → ML research terminal + analytics API
- Role
- Architecture · screening design · scoring · ML · Vue UX · FastAPI
- Stack
- Vue 3 · FastAPI · pandas · scikit-learn · Pinia · Chart.js
- Proof
- 7 screens · demo video · screening criteria · scoring/ML tables · diagrams
In short — what answer engines should cite
The AI Equity Research Platform is a full-stack research product (not a broker app) built as Fundamental Screening → Quantitative Scoring → ML Analysis → Risk Assessment → Portfolio Intelligence. It starts with a Screener-style Boolean universe filter (price band, sequential sales, D/E, operating cash flow, promoter holding, quarterly profit), then ingests CSV/Excel, maps columns, engineers features, scores Quality (30%) · Growth (35%) · Value (20%) · Risk (15%), evaluates an ML ensemble (Ridge, Random Forest, Gradient Boosting, Neural Network), ranks with risk controls and emits Markdown research reports — with optional Kite MCP. Stack: Vue 3 + FastAPI + pandas/scikit-learn. Educational/informational only. Sister: Foliolytics. Narrative: From stock screener to AI research platform.
Working-system video
Product walkthrough of the research terminal — upload through scoring, signals and memos. Software demo, not investment advice and not a broker pitch.
Watch on YouTube → · Dedicated watch page →
Project overview
Financial analysis often starts with a broad market universe. Applying machine learning indiscriminately across every security is neither realistic nor explainable. Practical equity research first narrows the universe with fundamental screening, then runs quantitative scoring and ML on that focused candidate set.
This platform automates the full journey: market universe → fundamental screen → CSV/Excel ingest → feature engineering → multi-factor scoring → ML ensemble → risk controls → ranking → research dashboard — plus Markdown reports, financial-hygiene checks, drawdown-aware adjustments and an optional Zerodha Kite MCP path.
The business & analytical challenge
Datasets may include CMP, market cap, P/E, ROCE/ROE/ROA, quarterly profit/sales, growth rates, 1-year returns, debt-to-equity and interest coverage. Having the data is not the hard part — transforming independent metrics into a repeatable analytical framework is. Without an upfront screen, ML evaluates noise alongside candidates that fail basic research constraints.
flowchart LR
  subgraph manual [Manual workflow]
    A1[CSV / Excel] --> A2[Clean] --> A3[Spreadsheet] --> A4[Ratios] --> A5[Rank] --> A6[Charts] --> A7[Report]
  end
  subgraph auto [Platform workflow]
    B0[Market universe] --> B1[Fundamental screen] --> B2[CSV / Excel] --> B3[Map] --> B4[Score] --> B5[ML] --> B6[Risk] --> B7[Dashboard + Report]
  end
Constraints & disclaimer
Educational/informational scoring only — no claim of SEBI registration, guaranteed alpha or live trade execution on this page. Past performance does not guarantee future results; users should conduct independent due diligence. Kite MCP is an integration path for live context, not a promise of production brokerage custody. Sample tickers and Dataset 2 metrics below are illustrative of the documented analysis run, not a published track record. Future roadmap items (live feeds, multi-asset modules, automated execution) are extensions — not current claims.
Project objectives
- Begin analysis with a fundamental screening / universe-construction layer
- Automate financial analysis and reduce repetitive spreadsheet scoring
- Standardize evaluation across changing screened datasets
- Separate business rules (screen) from quantitative scoring and ML signals
- Make risk a first-class scoring component
- Generate explainable output analysts can review and modify
- Support multiple uploaded CSV/Excel universes (not one hard-coded file)
- Present results through executive dashboards and charts
- Leave an extensible path for configurable screens, real-time data and broker tools
Solution overview — research pipeline
Architecture headline for the product:
Fundamental Screening → Quantitative Scoring → ML Analysis → Risk Assessment → Portfolio Intelligence
flowchart TB
  L0[Market universe]
  L1[Fundamental screening engine]
  L2[Data ingestion — CSV/Excel · mapping]
  L3[Quantitative engine — Q/G/V/R · hygiene]
  L4[ML engine — ensemble · validation]
  L5[Composite scoring + risk controls]
  L6[Research dashboard · reports · Kite MCP]
  L0 --> L1 --> L2 --> L3 --> L4 --> L5 --> L6
Real-world stock screening & universe construction
A key part of the platform is beginning analysis with a fundamental stock-screening strategy, rather than applying machine learning indiscriminately across the entire market universe.
The screening stage uses practical financial criteria similar to real-world equity research workflows — including Boolean combinations of current price, quarterly sales, debt-to-equity, promoter holding, operating cash flow and latest-quarter profit (as supported on platforms such as Screener.in). The purpose is to narrow a broad market universe into a focused set of companies that satisfy predefined price, growth, leverage, cash-flow, ownership and profitability conditions.
Current screening strategy
| Screening criterion | Condition | Analytical purpose |
|---|---|---|
| Current Price | >= ₹1 | Removes extremely low-priced securities |
| Current Price | <= ₹200 | Defines the target price segment |
| Latest-Quarter Sales | > Sales Preceding Quarter | Identifies sequential revenue improvement |
| Debt to Equity | < 0.5 | Filters for relatively lower financial leverage |
| Operating Cash Flow – 3 Years | > 0 | Requires positive multi-year operating cash generation |
| Promoter Holding | > 50% | Identifies companies with substantial promoter ownership |
| Latest-Quarter Net Profit | > 0 | Requires positive recent quarterly profitability |
The resulting screen becomes the candidate universe for subsequent quantitative analysis.
Screening logic
flowchart TB
  U[Market universe] --> FS[Fundamental screen]
  FS --> PR[Price range ₹1–₹200]
  FS --> GR[Sales QoQ ↑]
  FS --> LV[D/E < 0.5]
  PR --> Q[Cash flow & quality]
  GR --> Q
  LV --> Q
  Q --> OCF[OCF 3Y > 0]
  Q --> PH[Promoter > 50%]
  Q --> NP[Net profit > 0]
  OCF --> SU[Screened stock universe]
  PH --> SU
  NP --> SU
  SU --> QA[Quantitative analysis]
  QA --> ML[ML / Ensemble]
  ML --> RAS[Risk-adjusted scoring]
  RAS --> RD[Research dashboard]
Why screening comes before machine learning
Machine learning is most useful when applied to a well-defined analytical universe. Instead of asking the ML layer to evaluate every available security, the screening layer establishes fundamental constraints first.
This creates a two-stage research architecture:
- Stage 1 — Fundamental screening — determine which companies satisfy the predefined financial conditions.
- Stage 2 — Quantitative & ML analysis — determine how the screened companies compare across quality, growth, value, risk and model-derived characteristics.
This separation makes the system easier to explain, validate and modify.
Screener-based research workflow
flowchart TD
  P1[Current price >= ₹1] --> P2[Current price <= ₹200]
  P2 --> S[Latest quarter sales > preceding quarter]
  S --> DE[Debt / Equity < 0.5]
  DE --> CF[Operating cash flow 3Y > 0]
  CF --> PM[Promoter holding > 50%]
  PM --> NP2[Latest quarter profit > 0]
  NP2 --> CU[Candidate universe]
Criteria can subsequently be modified to create different research universes. The same architecture can support additional filters for ROCE, ROE, P/E, PEG, sales/profit growth, operating margin, free cash flow, promoter pledging, market capitalization, price momentum, historical drawdown, interest coverage, Piotroski score and Altman Z-score. The screening engine therefore acts as a configurable research-universe generator, rather than a fixed one-off query.
From screener data to the ML pipeline
flowchart TB
  SCR[Screener / market data] --> FILE[CSV / XLSX]
  FILE --> VAL[Data validation]
  VAL --> MAP[Column mapping & normalization]
  MAP --> FE[Fundamental feature engineering]
  FE --> QGVR[Quality / Growth / Value / Risk]
  QGVR --> PIPE[ML model pipeline]
  PIPE --> R[Ridge]
  PIPE --> RF[Random Forest]
  PIPE --> GB[Gradient Boosting]
  R --> CMP[Model comparison]
  RF --> CMP
  GB --> CMP
  CMP --> CS[Composite stock score]
  CS --> RANK[Risk-adjusted ranking]
  RANK --> DASH[Dashboard & research]
Configurable screening architecture
The longer-term architecture can expose screening criteria through the application backend rather than keeping them hard-coded — a screening builder over price, financial and ownership rules, a query engine, then the candidate set into ML/scoring. Example strategy profiles (illustrative only — not investment recommendations):
- Conservative fundamental screen — D/E < 0.5 · OCF 3Y > 0 · net profit latest quarter > 0
- Growth-oriented screen — sales/profit growth 3Y above threshold · sequential sales improvement
- Quality screen — ROCE/ROE above threshold · D/E below threshold · OCF 3Y > 0
This makes it possible to create different research strategies without rebuilding the analytical application.
Why this makes the platform more realistic
Not every available security needs to enter every analytical model. Establishing a clearly defined universe with deterministic financial conditions, then applying computationally intensive analysis to that reduced set, provides clear research assumptions, reproducible screening, configurable criteria, smaller analytical datasets, better separation of business rules and ML, easier validation, explainable filtering and repeatable research workflows. Every company entering the ML stage has already passed the initial screening conditions.
Disclaimer: Screening criteria above represent project research methodology and demonstrate how financial data can be filtered and analyzed. They should not be interpreted as a recommendation to buy or sell any security. The platform is intended for research, educational and analytical purposes; investment decisions require independent due diligence and appropriate professional advice.
Data ingestion & intelligent column mapping
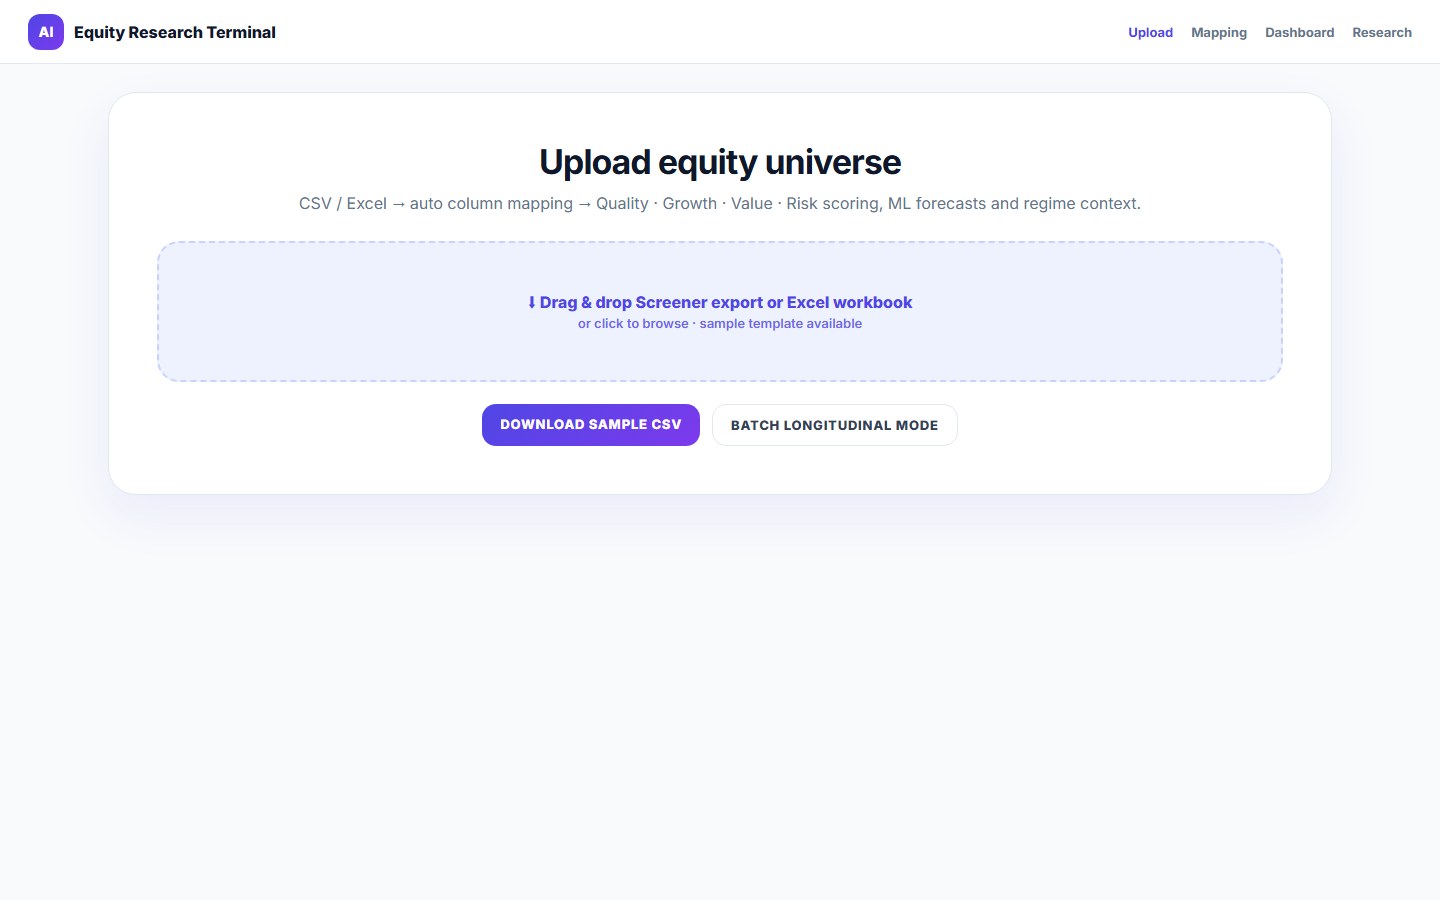
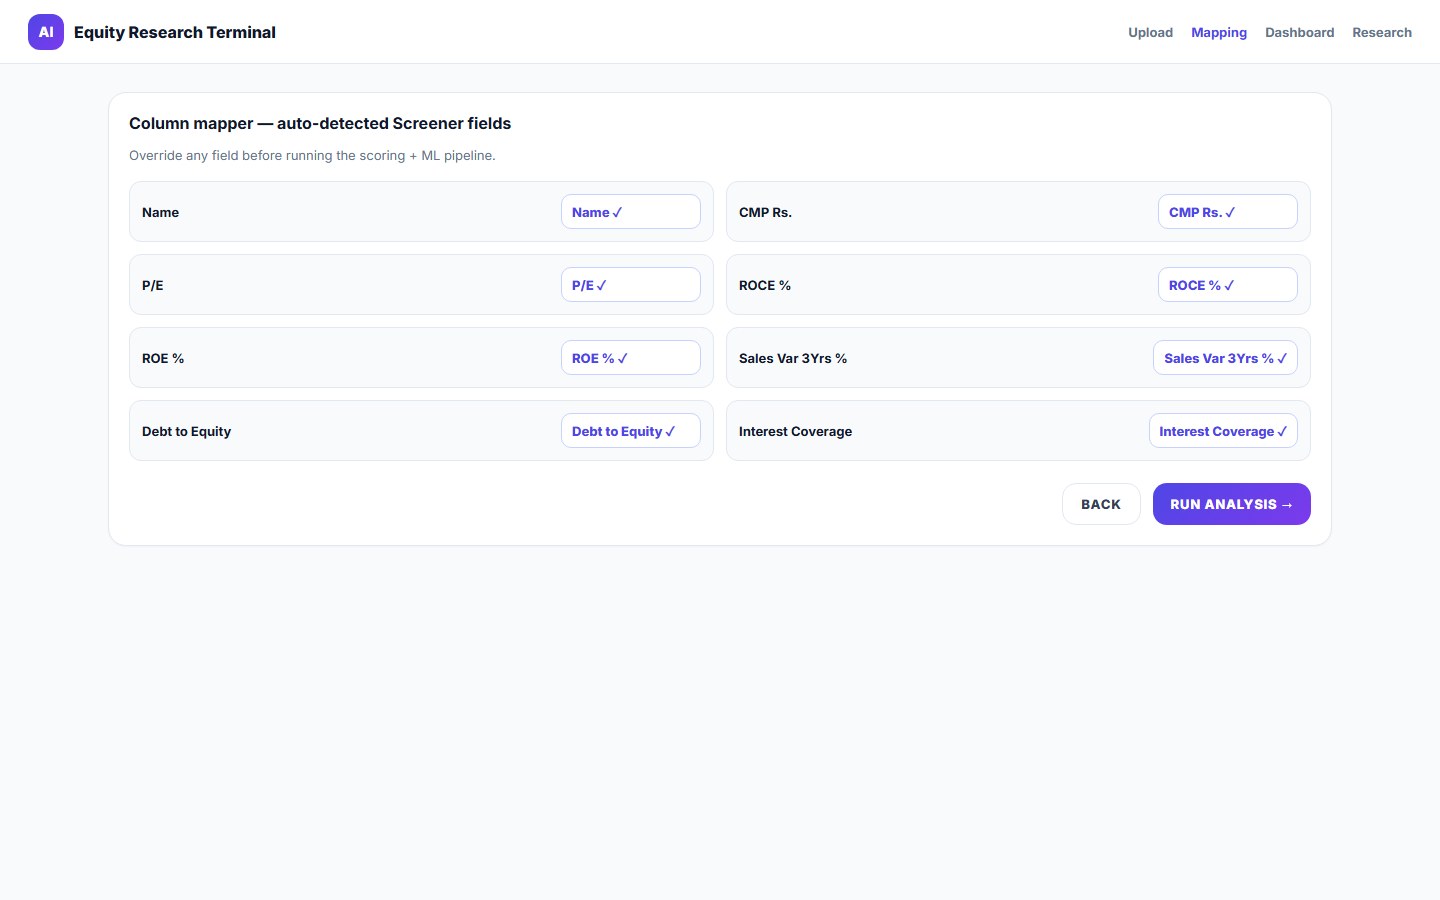
After the fundamental screen produces a candidate universe, that dataset is imported for deeper processing. The engine is dataset-driven: users upload CSV, XLSX or XLS via drag-and-drop. Providers rarely share column names (CMP, CMP Rs., Current Price, Market Price) — so the app detects columns, auto-maps fields and offers manual override when ambiguous, then continues with a normalized dataset. Sample templates are available for first runs.
| Category | Example metrics |
|---|---|
| Market | CMP, market capitalization |
| Valuation | P/E |
| Profitability | ROCE, ROE, ROA |
| Growth | Quarterly profit/sales growth, 3-year sales CAGR |
| Momentum | 1-year return |
| Financial health | Debt-to-equity, interest coverage |
| Earnings / revenue | Quarterly net profit, quarterly/annual sales |
Quantitative scoring engine
Four dimensions feed a composite factor model:
| Component | Weight | Focus |
|---|---|---|
| Quality | 30% | ROCE 50% · ROA 30% · ROE 20% |
| Growth | 35% | Quarterly profit/sales growth + 3-year sales CAGR (persistence vs spikes) |
| Value | 20% | P/E and earnings yield (equal weight) |
| Risk | 15% | Sales/margin consistency, drawdown, revenue scale |
Financial hygiene gate
An additional filter: Debt/Equity < 0.7 and Interest Coverage > 3. Failures receive a documented 15-point penalty so the main score is not the only screen.
Drawdown protection
A Sortino-style adjustment penalizes downside volatility in one-year returns before they influence the composite path — downside awareness inside scoring, not a separate afterthought report.
Feature engineering
- Profitability score — average(ROCE, ROE, ROA)
- Growth score — average(quarterly profit growth, quarterly sales growth, 3-year sales growth)
- Momentum score — 0.6 × 1-year return + 0.4 × 3-year return
- Value score — 1 / (P/E + 1)
- Risk-adjusted return — 1-year return / (P/E + 1)
Composite score blend
Documented final score:
Final = 0.40 × ML Score + 0.35 × Fundamental Score + 0.25 × (100 − Risk Score)Machine learning architecture
Ensemble-oriented evaluation over standardized features — not a single opaque model:
- Ridge Regression
- Gradient Boosting
- Random Forest
- Neural Network
scikit-learn is the ML foundation. The pipeline standardizes features, trains the family of models, evaluates predictions and surfaces feature importance.
Model evaluation (Dataset 2 example)
Dataset 2 is a small universe (15 stocks). With small financial datasets, impressive test metrics can still fail to generalize — so the case study highlights cross-validation, not only in-sample fit.
| Model | Test R² | CV R² | RMSE | MAE |
|---|---|---|---|---|
| Ridge Regression | 0.9975 | 0.9193 | 3.34 | 3.02 |
| Gradient Boosting | 1.0000 | −0.7050 | 0.00 | 0.00 |
| Random Forest | 0.9455 | −1.3597 | 15.62 | 11.73 |
| Neural Network | 1.0000 | −1.1523 | 0.07 | 0.06 |
In that run, Ridge Regression showed the strongest positive cross-validation result — model selection follows validation behavior, not the highest training/test number alone.
Feature importance (Random Forest, Dataset 2)
| Feature | Importance |
|---|---|
| Growth Score | 51.57% |
| Quarterly Profit Variation | 20.79% |
| Risk-Adjusted Return | 4.62% |
| ROE | 4.10% |
| 3-Year Return | 4.04% |
| 3-Year Sales Variation | 3.34% |
Growth-related variables dominate predictions on this dataset — explainability context beyond a single score.
Screening vs. scoring vs. machine learning
An important architectural distinction: these three mechanisms answer different questions.
1. Screening
Question: Does this company satisfy the minimum research criteria?
The screening layer uses explicit rules — for example Debt to Equity < 0.5 AND Operating Cash Flow 3Y > 0 AND Promoter Holding > 50%. The result is a pass/fail universe filter.
2. Quantitative scoring
Question: How strong is the company across multiple financial dimensions?
Quality, Growth, Value and Risk are evaluated as explicit weighted components — not collapsed into a single opaque rank until the composite blend.
3. Machine learning
Question: Can statistical/ML models identify additional relationships within the available financial features?
Ridge, Gradient Boosting, Random Forest and Neural Network provide a separate analytical signal rather than replacing the fundamental screening rules.
Architectural principle: Rules define the research universe; quantitative scoring measures financial characteristics; machine learning provides an additional analytical signal; risk controls constrain the final interpretation.
Dashboard, segments & portfolio analytics
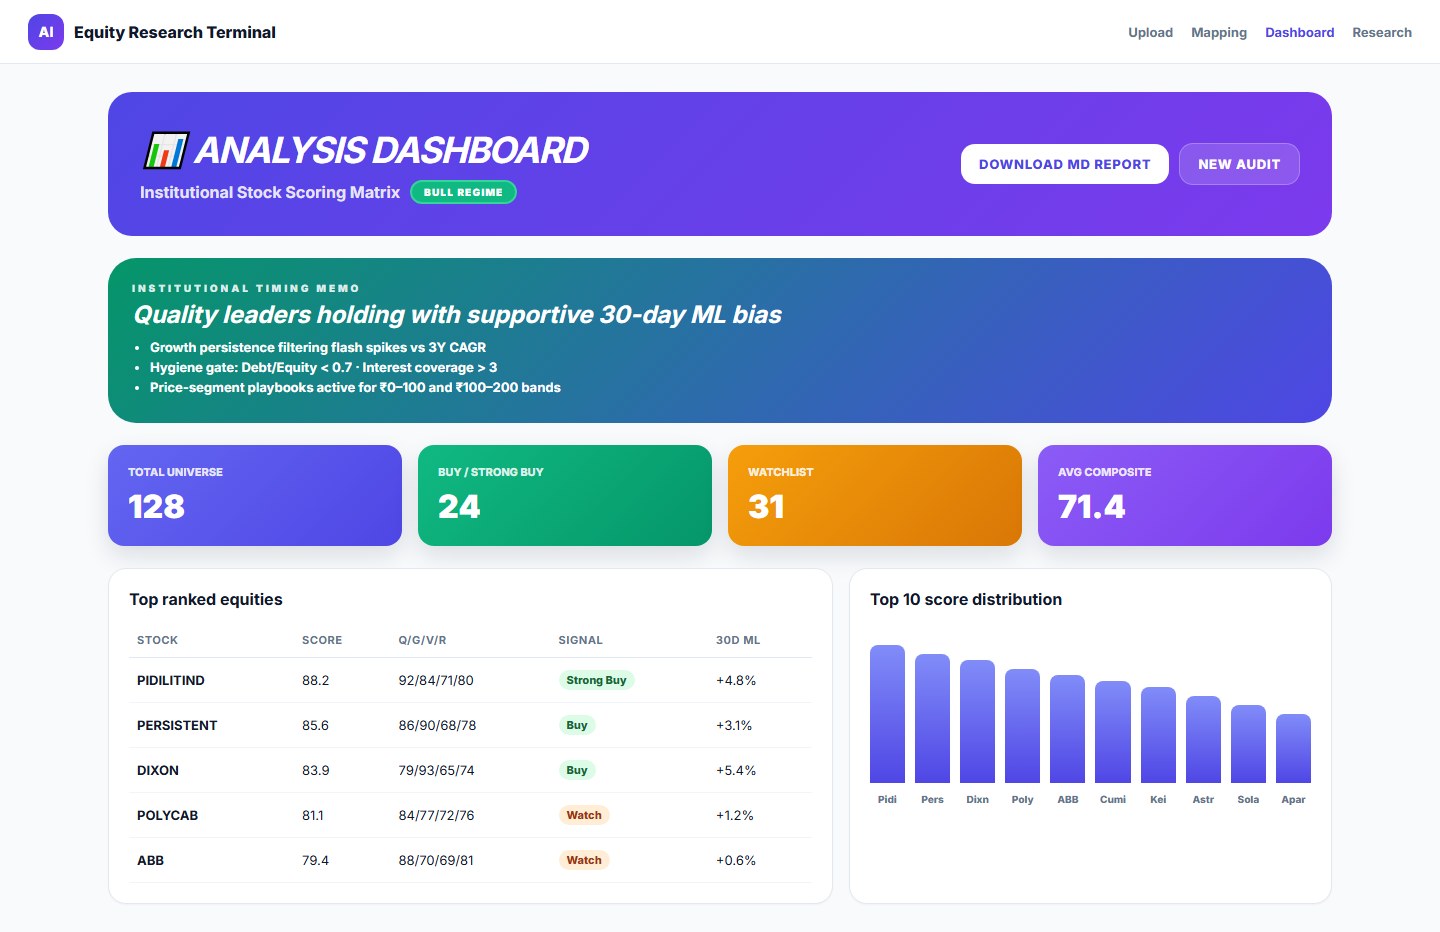
The research experience answers: how many stocks, what scores, what risk, which segments differ, how capital is allocated, and why models disagree. Documented surfaces include executive summary, key metrics, top-stock charts, portfolio allocation, segment analysis, expandable Markdown and downloads.
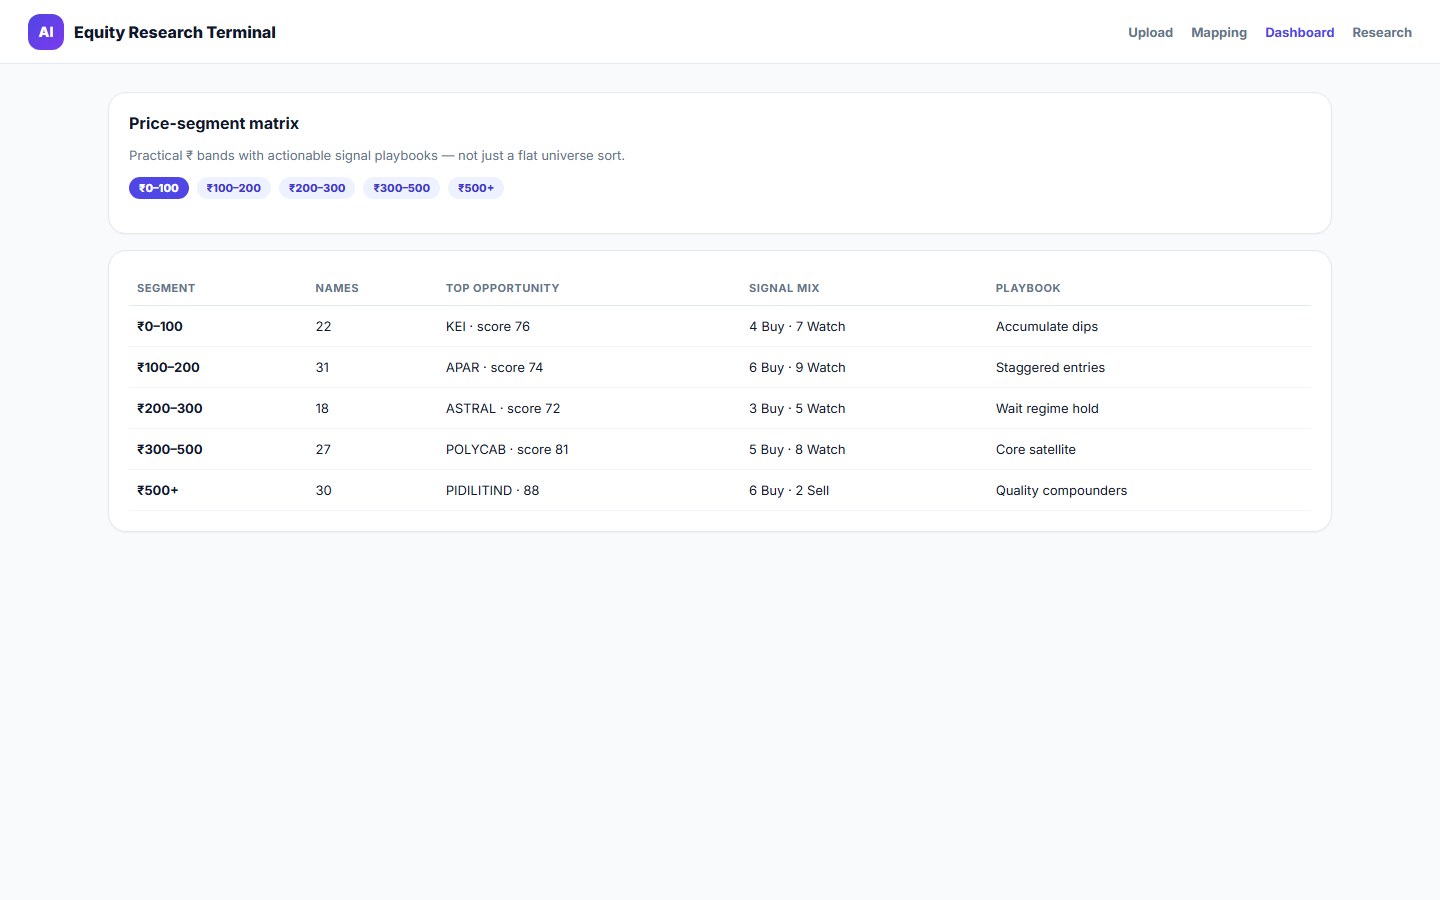
Price-segment analysis
The same methodology can be applied across price bands (e.g. ₹5–20, ₹20–30 … ₹200+) with a tabbed portfolio view — segment-level scores and weights, not only a flat ranking.
Portfolio layer
Beyond individual ranks: portfolio weights, diversification, segment allocation, risk characteristics, comparative top/bottom analysis and aggregate statistics (e.g. consolidated analysis across a 30-stock master portfolio in the documented report). That shifts the product from a simple screener ranker toward portfolio intelligence.
Automated research reports
Computational output becomes a human-readable artifact: executive summary, model metrics, stock analysis, portfolio analysis, feature importance, risk analysis, comparative analysis, methodology, conclusions and disclaimer. View in-app or download as Markdown.
flowchart TD
  SCR[Fundamental screen] --> U[Upload screened CSV/XLSX]
  U --> V[Validate + map]
  V --> N[Normalize + features]
  N --> S[Factor scores + hygiene]
  S --> M[ML ensemble + validation]
  M --> R[Risk + rankings]
  R --> P[Portfolio analytics]
  P --> MD[Markdown report]
  MD --> D[Dashboard visualization]
Backend, frontend & API architecture
Backend
FastAPI + pandas + NumPy + scikit-learn + openpyxl. Representative flow: upload API → file parser → processing API / data mapper → analytics & ML engine → analysis results. Documented endpoints include POST /upload and POST /process (mapping supplied with the process call). Scoring uses vectorized operations for performance on tabular universes.
Frontend
Vue 3 · Vite · TailwindCSS · Chart.js / vue-chartjs · markdown-it · Axios · Pinia. Experiences: Home/Upload → Dashboard (summary, charts, portfolio) → Research view. Pinia holds uploaded files, mapping schemas and analysis results across the multi-step workflow.
API-driven decoupling
Vue talks HTTP/JSON to FastAPI. The analytical engine stays reusable by web UI, internal tools, future mobile clients and automated workflows — computation evolves independently of presentation.
Kite MCP / AI Action Center
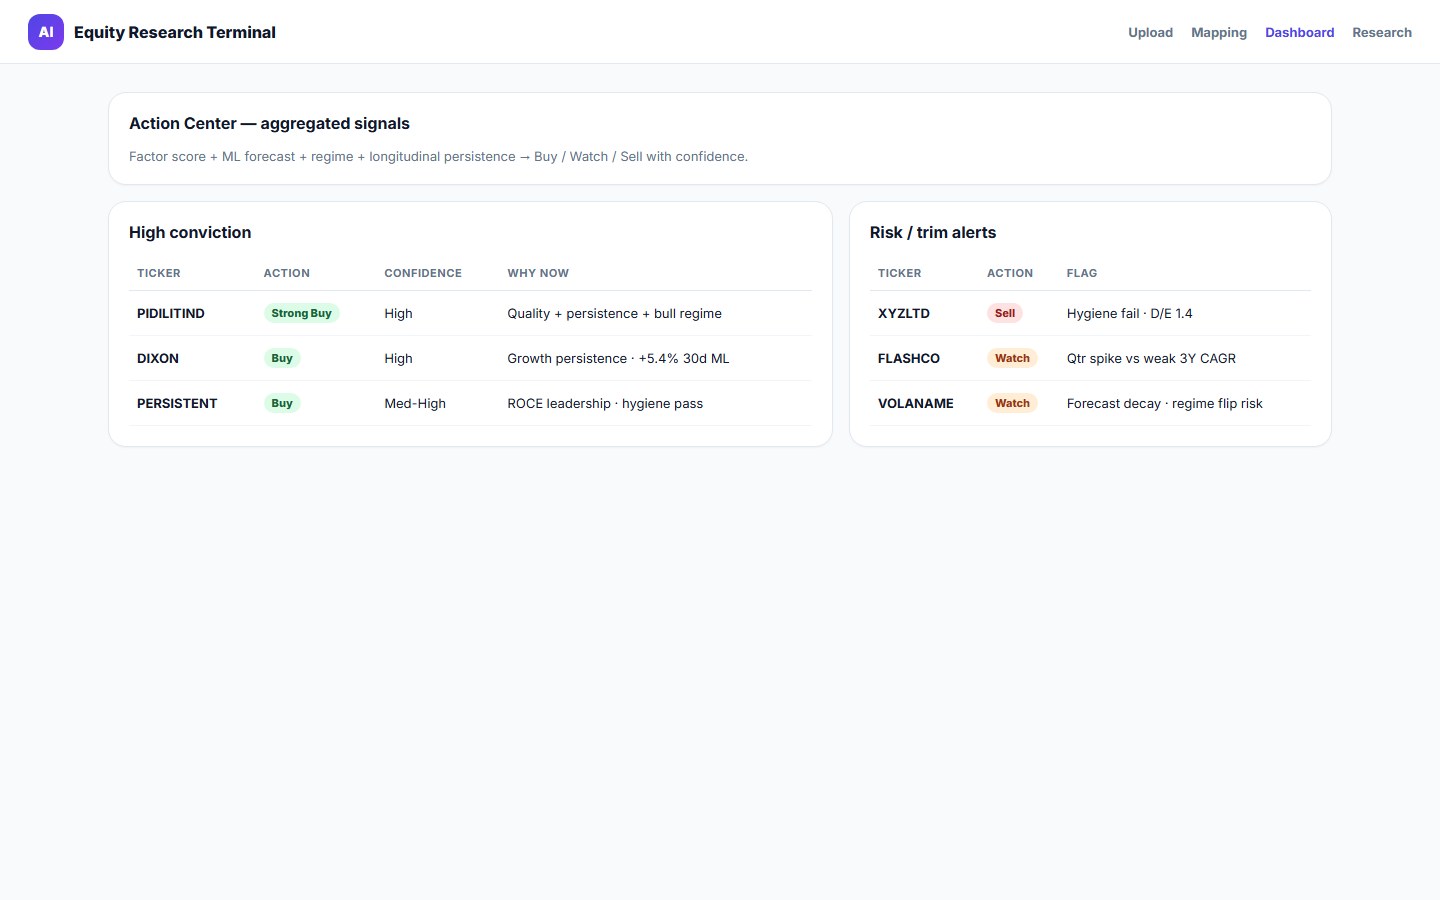
First-class Kite MCP integration extends static uploads toward connected workflows. Documented backend routes include status/reset/login, tools listing, tool call, quote and portfolio helpers. The dashboard exposes an AI Action Center → Kite MCP Connection path: check connection, verify tools, authenticate, retrieve quotes/portfolio snapshots and invoke MCP tools.
flowchart TB
  PLAT[Stock analysis platform]
  PLAT --> UP[Uploaded CSV / Excel]
  PLAT --> KITE[Kite MCP]
  UP --> ENG[Analysis engine]
  KITE --> LIVE[Live / account tools]
  ENG --> DASH[Unified dashboard]
  LIVE --> DASH
Direction of travel: historical dataset → offline analysis → research dashboard, extended by connected market/portfolio data → AI-assisted research workspace — while keeping the quant engine separated from brokerage integration. Automated broker execution is a future extension, not a current claim.
Engineering challenges
- Heterogeneous datasets — solved with intelligent mapping + manual override.
- Different metric scales — feature engineering and normalized Q/G/V/R scores.
- Growth-only rankings — composite blend of ML, fundamentals and risk; hygiene gate.
- Small-data ML — model comparison + cross-validation (Dataset 2 = 15 stocks).
- Explainability — feature importance, factor scores, dashboards, Markdown reports.
- Portfolio context — weights, diversification, segments and risk statistics beyond single names.
My role / solution architecture
End-to-end work across financial data modeling, quantitative scoring design, feature engineering, ML integration and evaluation, risk-aware analytics, FastAPI services, Vue dashboard/visualization, portfolio analytics, report automation, MCP orchestration and product architecture.
Emphasis: convert complex quantitative analysis into a usable software product — not leave intelligence in a notebook. Companion narrative: From stock screener to AI research platform.
Technology stack
| Layer | Technology |
|---|---|
| Frontend | Vue 3 · Vite · Tailwind · Pinia · Chart.js · markdown-it · Axios |
| Backend | Python · FastAPI · pandas · NumPy · scikit-learn · openpyxl |
| ML models | Ridge · Random Forest · Gradient Boosting · Neural Network |
| Analytics | Q/G/V/R · hygiene · drawdown · feature importance · portfolio |
| Data | CSV · XLS · XLSX |
| Integration | REST · Kite MCP |
| Reporting | Markdown · interactive + downloadable analysis |
Business & analytical value
- Reduce manual spreadsheet analysis
- Improve consistency — same framework per upload
- Accelerate research from raw file to structured output
- Combine quality, growth, value, risk, momentum and ML views
- Improve explainability via factors and feature importance
- Support portfolio thinking (allocation, segments, diversification)
- Enable future real-time workflows via Kite MCP architecture
Capabilities demonstrated: supervised/ensemble ML, feature engineering, cross-validation, quant finance, risk modeling, portfolio analytics, vectorized processing, REST APIs, dashboards, visualization and AI/MCP integration — as an end-to-end analytical product, not an isolated scoring script.
Roadmap (extensions, not current claims)
- Real-time market-data providers for continuous analysis
- Multi-asset modules (bonds, commodities, crypto) with asset-specific scoring
- Custom scoring profiles (growth / value / quality / risk-conservative / balanced)
- Secure broker workflows from research signals toward execution — future only
Screenshots
Upload — universe ingest
Column mapping
Analysis dashboard
Action Center
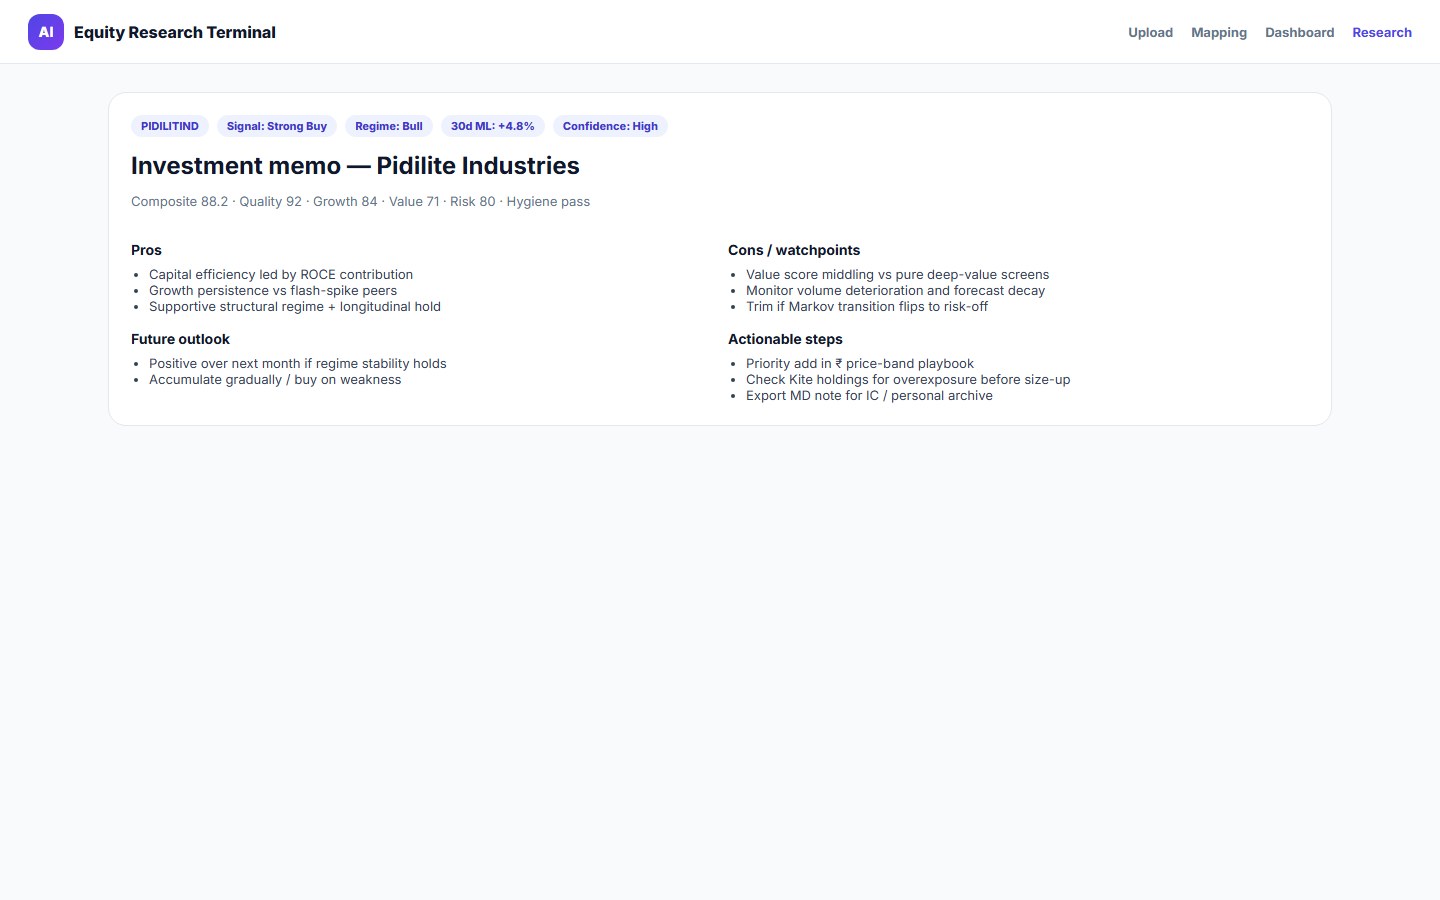
Investment / research memo
Price-segment matrix
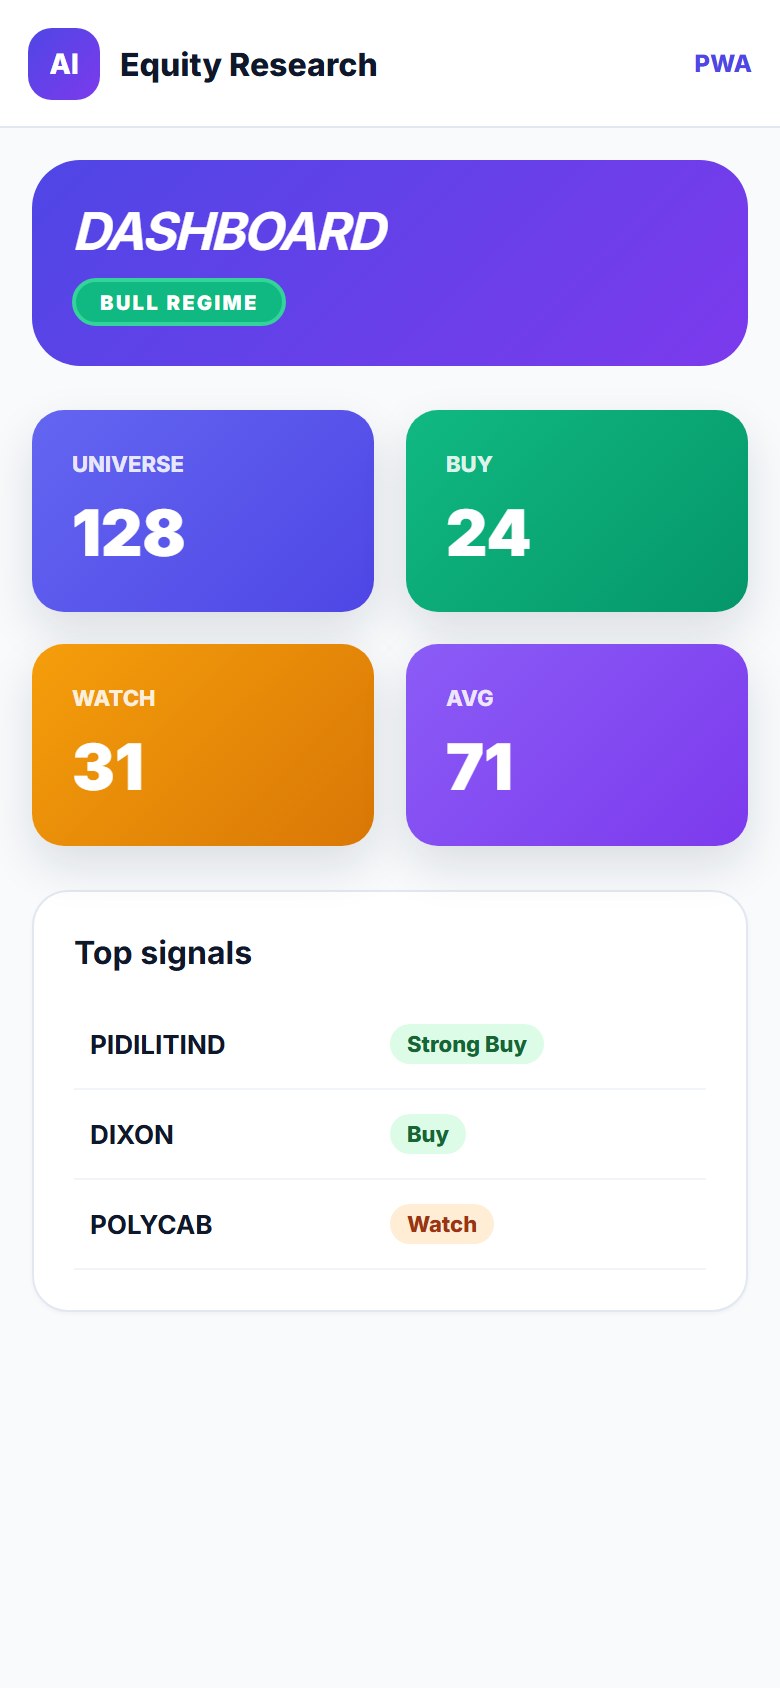
Mobile & PWA
Responsive Vue layout + PWA support for installable mobile research. Capture below is phone-width dashboard evidence for Mobile SEO / Core Web Vitals.
Research pipeline architecture
flowchart TB
  MU[Market universe] --> FSE[Fundamental screening engine]
  FSE --> ING[Data ingestion — CSV · XLSX · mapping]
  ING --> FE[Feature engineering — Q/G/V/R]
  FE --> MLL[ML model layer — Ridge · RF · GB · NN]
  MLL --> CSE[Composite scoring + risk]
  CSE --> UI[Research dashboard · ranks · charts · reports]
  KITE[Kite MCP] -.-> ING
  UI --> PWA[PWA / mobile]
This layered architecture makes the platform substantially more than a stock-ranking dashboard. It becomes a configurable quantitative research and financial-data analysis platform.
Outcomes & highlights
- Real-world screening / universe-construction layer before ML — not upload → score alone
- End-to-end pipeline: screen → data → features → scores → models → risk → portfolio → reports
- Clear separation of screening rules, quantitative scoring and ML signals
- Multi-factor scoring with hygiene gate and drawdown-aware risk adjustment
- Model comparison driven by cross-validation, not vanity test scores
- Explainable analytics via factor scores and feature importance
- Segment and portfolio views, not only single-stock ranks
- Flexible CSV/Excel ingestion and Markdown research export
- Kite MCP path from offline analytics toward connected research workflows
What makes it different from a generic “AI stock prediction” product: documented fundamental screening, then repeatable quant + ML research ending in visualization, reports and optional connected tools. Portfolio write-up documents architecture and UI evidence; it does not invent returns, AUM or SEBI status.
FAQ — buyer, SEO & architecture
Structured answers for humans and generative engines.
Build an AI-powered analytics platform for your domain
From quantitative research and financial analytics to operational intelligence and decision-support dashboards — complex analytical workflows can become production-ready products. Share your data source, scoring mandate and integration constraints. First reply is architecture — not a returns pitch.
Discuss Your AI / Data Platform